Finding Memory Eating Monsters in Golang
29 Dec 2023Sometimes, you might observe your program breaching all thresholds and taking up more memory than required. You might observe sawtooth patterns in your memory charts. This is a sign of classic Memory Leak, which eventually leads to OOM.
Enter, profiling, a set of tools and techniques to identify and debug this memory-eating code piece.
Identify bottlenecks, like, memory leaks, goroutine leaks or even get a trace of your function stack.
Go provides out-of-the-box tooling for profiling, pprof, available in the standard pkg under net/http/pprof.

Setup profiling
- Add import in main.go.
import _ "net/http/pprof"This indicates a shadow import in which we are importing the library but not using any of its functions. - Add the below code to start pprof server on
6060port which exposes/debug/pprofendpointgo func() { server := &http.Server{ Addr: "0.0.0.0:6060", } err := server.ListenAndServe() if err != nil && err != http.ErrServerClosed { panic(err) } }() - Now when you start your application, you can visit
http://localhost:6060/debug/pprof/.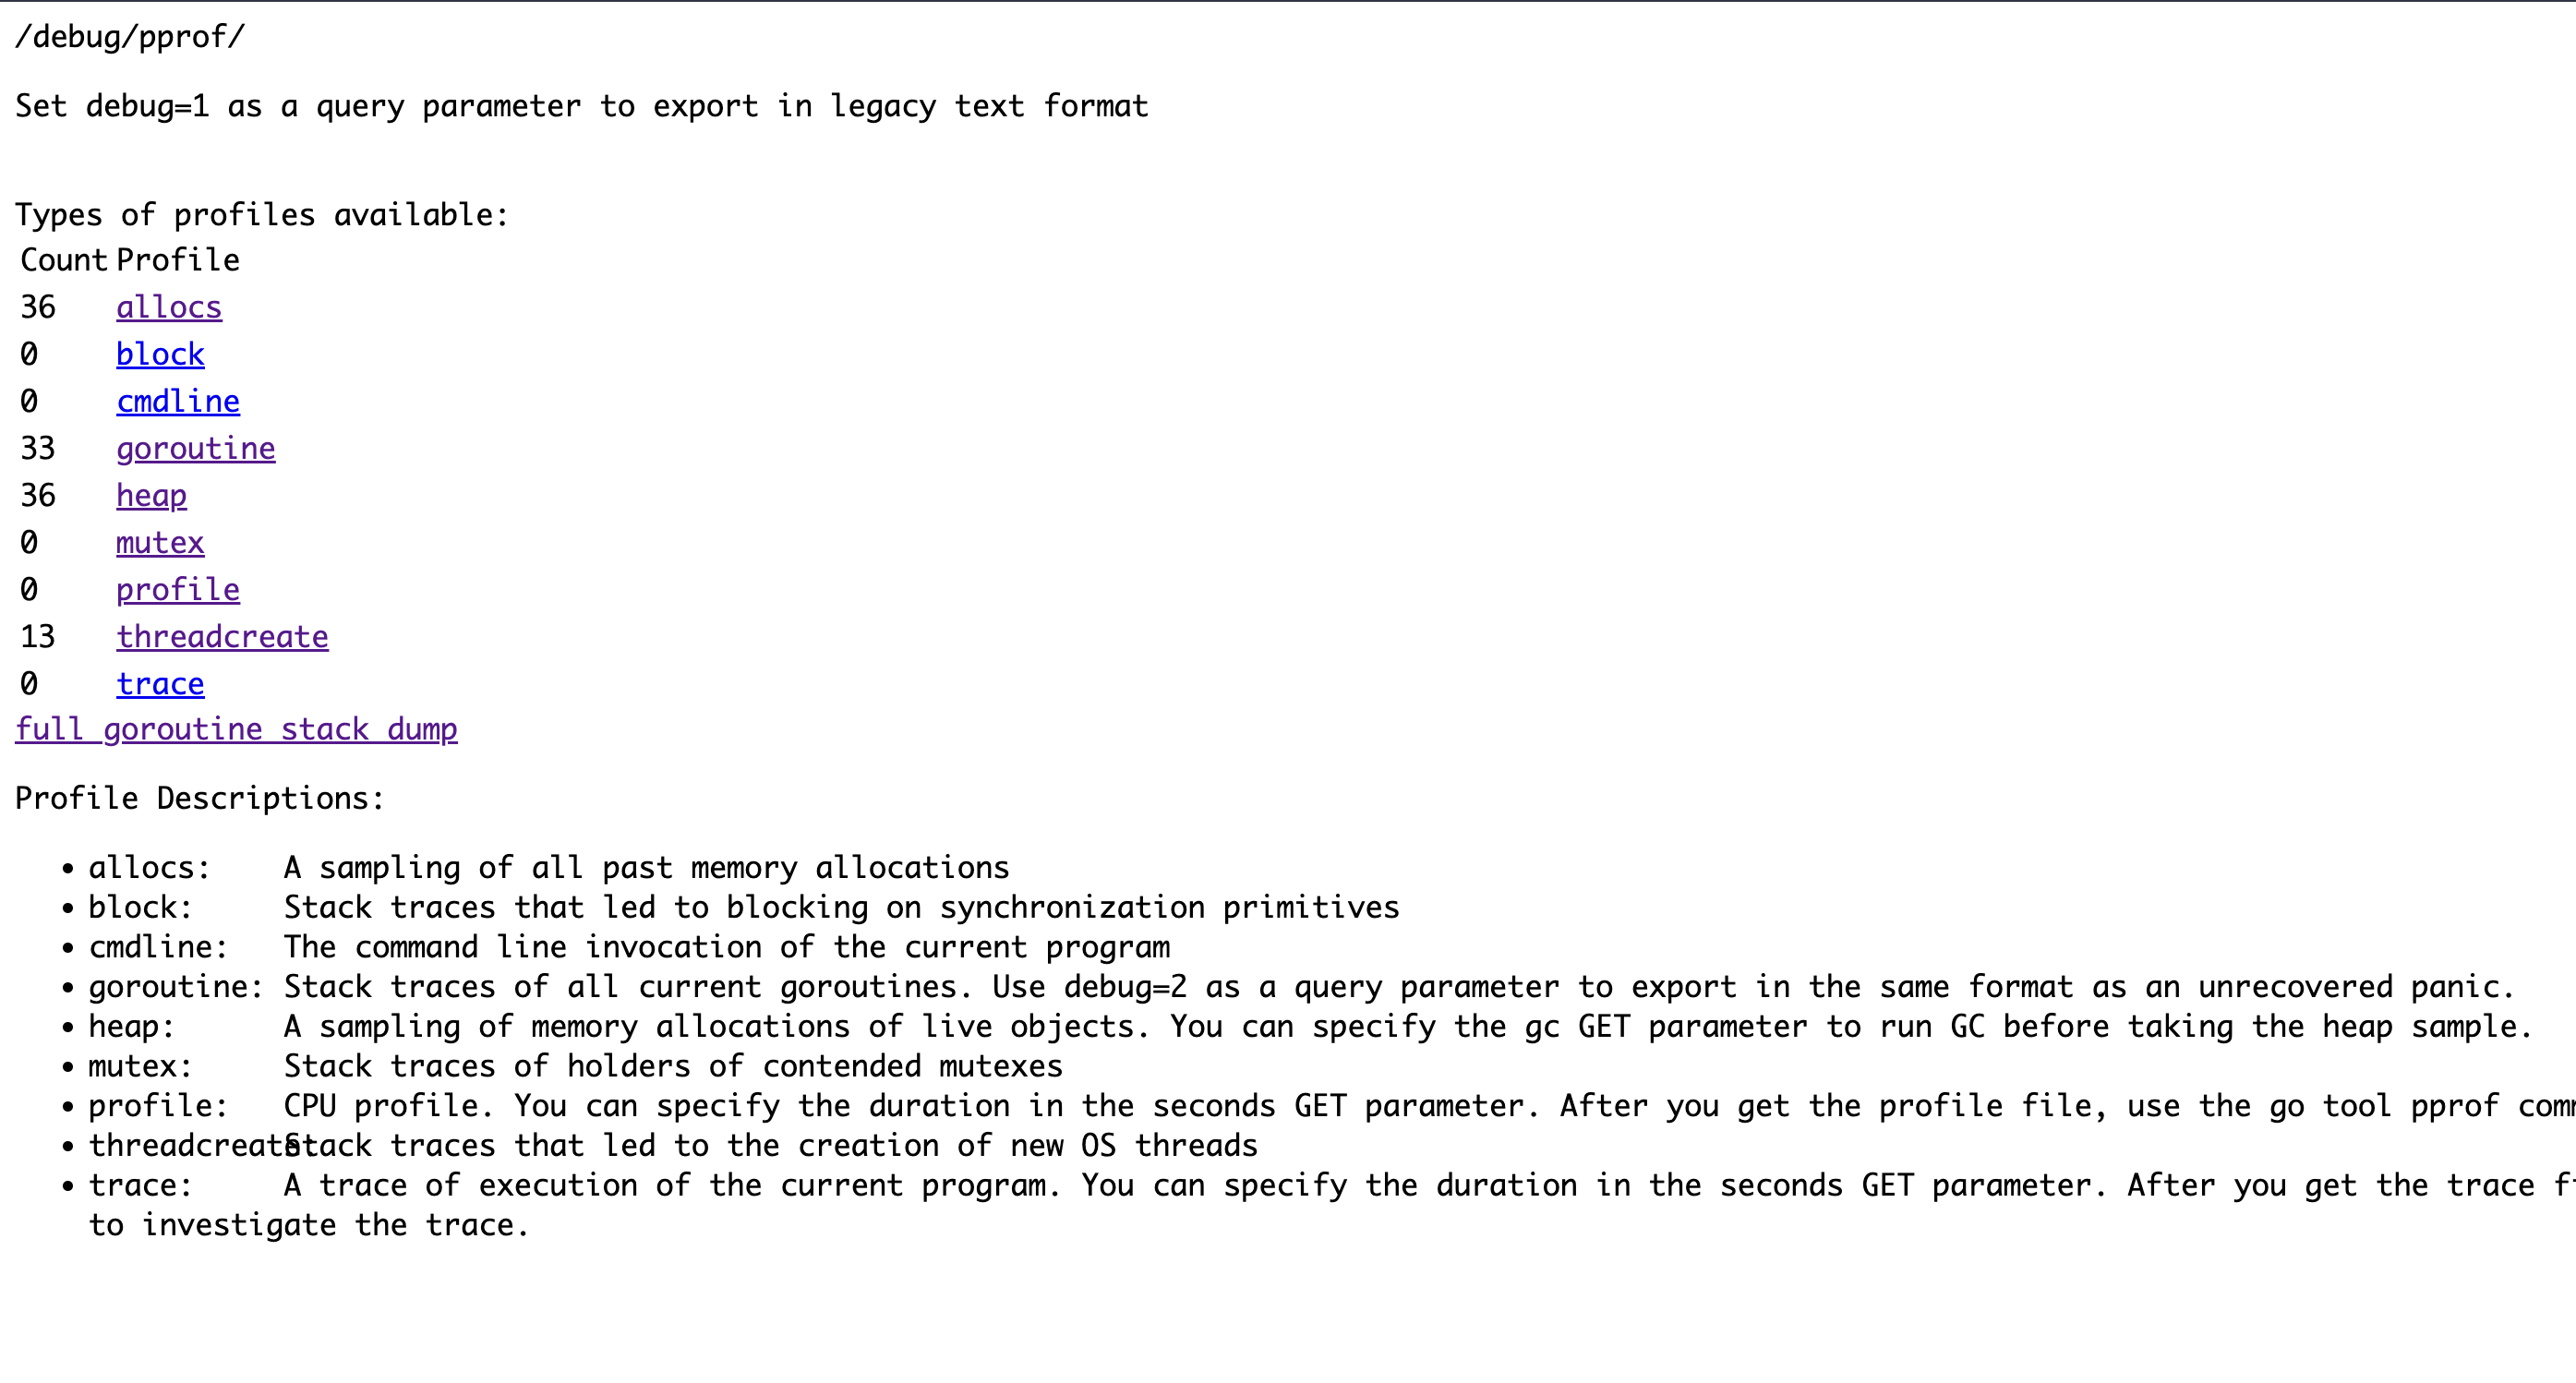
go tool
You can leverage go tool pprof to interact with the above profiles and get some insights.
Example: go tool pprof -trim_path=/go/pkg/mod -source_path=. -source_path=vendor http://localhost:6060/debug/pprof/allocs
→ go tool pprof -trim_path=/go/pkg/mod -source_path=. -source_path=vendor http://localhost:6060/debug/pprof/allocs
Fetching profile over HTTP from http://localhost:6060/debug/pprof/allocs
Saved profile in pprof/pprof.alloc_objects.alloc_space.inuse_objects.inuse_space.001.pb.gz
Type: alloc_space
Time: Dec 29, 2023 at 6:08pm (IST)
Entering interactive mode (type "help" for commands, "o" for options)
(pprof) top
Showing nodes accounting for 1927.52MB, 100% of 1928.02MB total
Dropped 5 nodes (cum <= 9.64MB)
      flat  flat%   sum%        cum   cum%
 1843.52MB 95.62% 95.62%  1927.52MB   100%  main.MemoryIntensiveFunc
      84MB  4.36%   100%       84MB  4.36%  strconv.formatBits
         0     0%   100%  1927.52MB   100%  main.main.func2
         0     0%   100%       84MB  4.36%  strconv.FormatInt
         0     0%   100%       84MB  4.36%  strconv.Itoa (inline)
(pprof)
This opens up an interactive session, in which you can run some basic commands to get more insights:
- top
- top -cum
You can also get a clean web view by using the web command, which opens a tab in the browser: (You will require Graphviz for this)
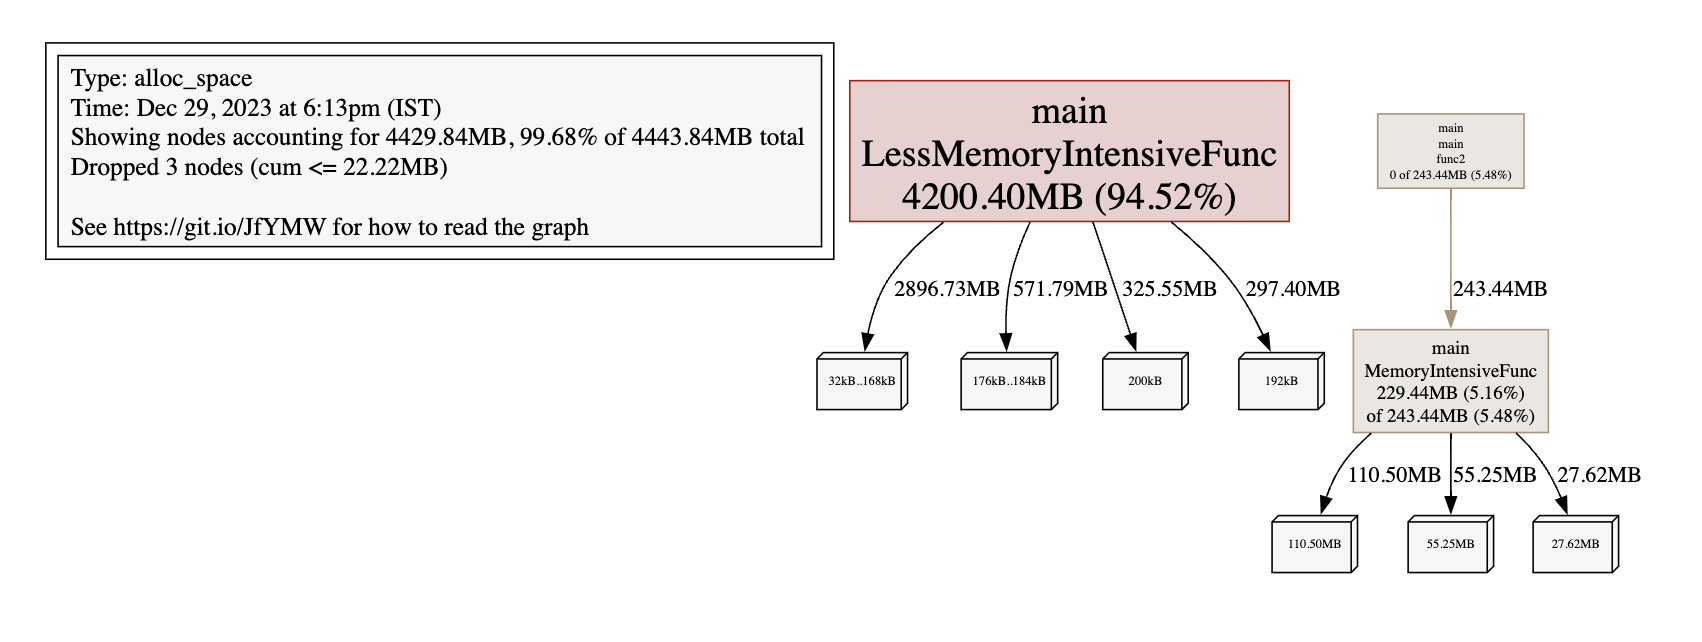
By default, when using top, some nodes are dropped, you can disable this by using -nodefraction=0.
Available Profiles
- goroutine: stack traces of all current Goroutines
- profile: stack traces of CPU returned by runtime
- heap: a sampling of memory allocations of live objects
- allocs: a sampling of all past memory allocations
- thread: stack traces that led to the creation of new OS threads
- block: stack traces that led to blocking on synchronization primitives
- mutex: stack traces of holders of contended mutexes
- trace: Trace of program execution
Difference b/w allocs and heap
allocs represents all the past memory allocation from the genesis of the program, including garbage collected values, but, heap represents the number of live allocated objects which does not include garbage collected bytes.
Difference b/w flat and cum
Flat means resources used only by this function, while cum (cumulative) means used by this function and functions called down the stack.
Getting trace of the program execution
curl -O trace.out http://localhost:6060/debug/pprof/tracego tool trace trace.out
This opens a web view where you can see the raw execution trace of the program.
Seeing Go’s gargbage collector at work
Go’s garbage collector works in the backgroud and perform a STW execution at regular intervals. We can see what the GC is doing by running program in debug mode GODEBUG=gctrace=1 go run main.go.
This starts printing some information to console:
gc 32 @1.158s 2%: 0.095+10+0.053 ms clock, 0.95+4.6/13/1.7+0.53 ms cpu, 45->80->53 MB, 53 MB goal, 10 P
Breaking down the GC debug output
gc 32 @1.158s 2%: 0.095+10+0.053 ms clock, 0.95+4.6/13/1.7+0.53 ms cpu, 45->80->53 MB, 53 MB goal, 10 P

gc 32                        : 32 GC runs since the program started
@1.158s                      : seconds elapsed since the program started
2%                           : 2% of the available CPU so far has been spent in GC

// wall clock
0.095ms                      : STW        : Write-Barrier - Wait for all Ps to reach a GC safe-point.
10ms                         : Concurrent : Marking
0.053 ms                     : STW        : Mark Term     - Write Barrier off and clean up.

// cpu time
0.95ms                       : STW        : Write-Barrier
4.6ms                        : Concurrent : Mark - Assist Time (GC performed in line with allocation)
13ms                         : Concurrent : Mark - Background GC time
1.7ms                        : Concurrent : Mark - Idle GC time
0.53ms                       : STW        : Mark Term

// heap memory
45->80->53 MB                : Heap memory in-use before the Marking started, Heap memory in-use after the Marking finished, Heap memory marked as live after the Marking finished
53 MB goal                   : Collection goal for heap memory in-use after Marking finished

10 P                         : Number of logical processors or threads used to run Goroutines.
pprof helps in identifying the bottlenecks, program performance and behaviour and proves to be a helpful tool to have in your Go arsenal.