Scaling AWS ECS Service on "non-conventional" metrics
16 Nov 2023AWS ECS provides CPU and Memory metrics out of the box and these can be used for creating scaling policies.
Extra metrics can be enabled during cluster creation or after cluster creation. However, this will incur extra costs on Cloudwatch.
All the above metrics, whether default or extra ones, can be used to configure scaling policies for an ECS service. There are two types of scaling policies supported by AWS ECS:
- Target tracking
- Step Scaling
Target Tracking
Target tracking increases or decrease the number of tasks that your service runs based on a target value for a specific metric, provided by ECS, namely CPU, Memory and ALB Request count (if registered on load balancer).
![]()
Step Scaling
This is where things get interesting. We can use any custom (or default shipped) Cloudwatch alarms to configure scaling.
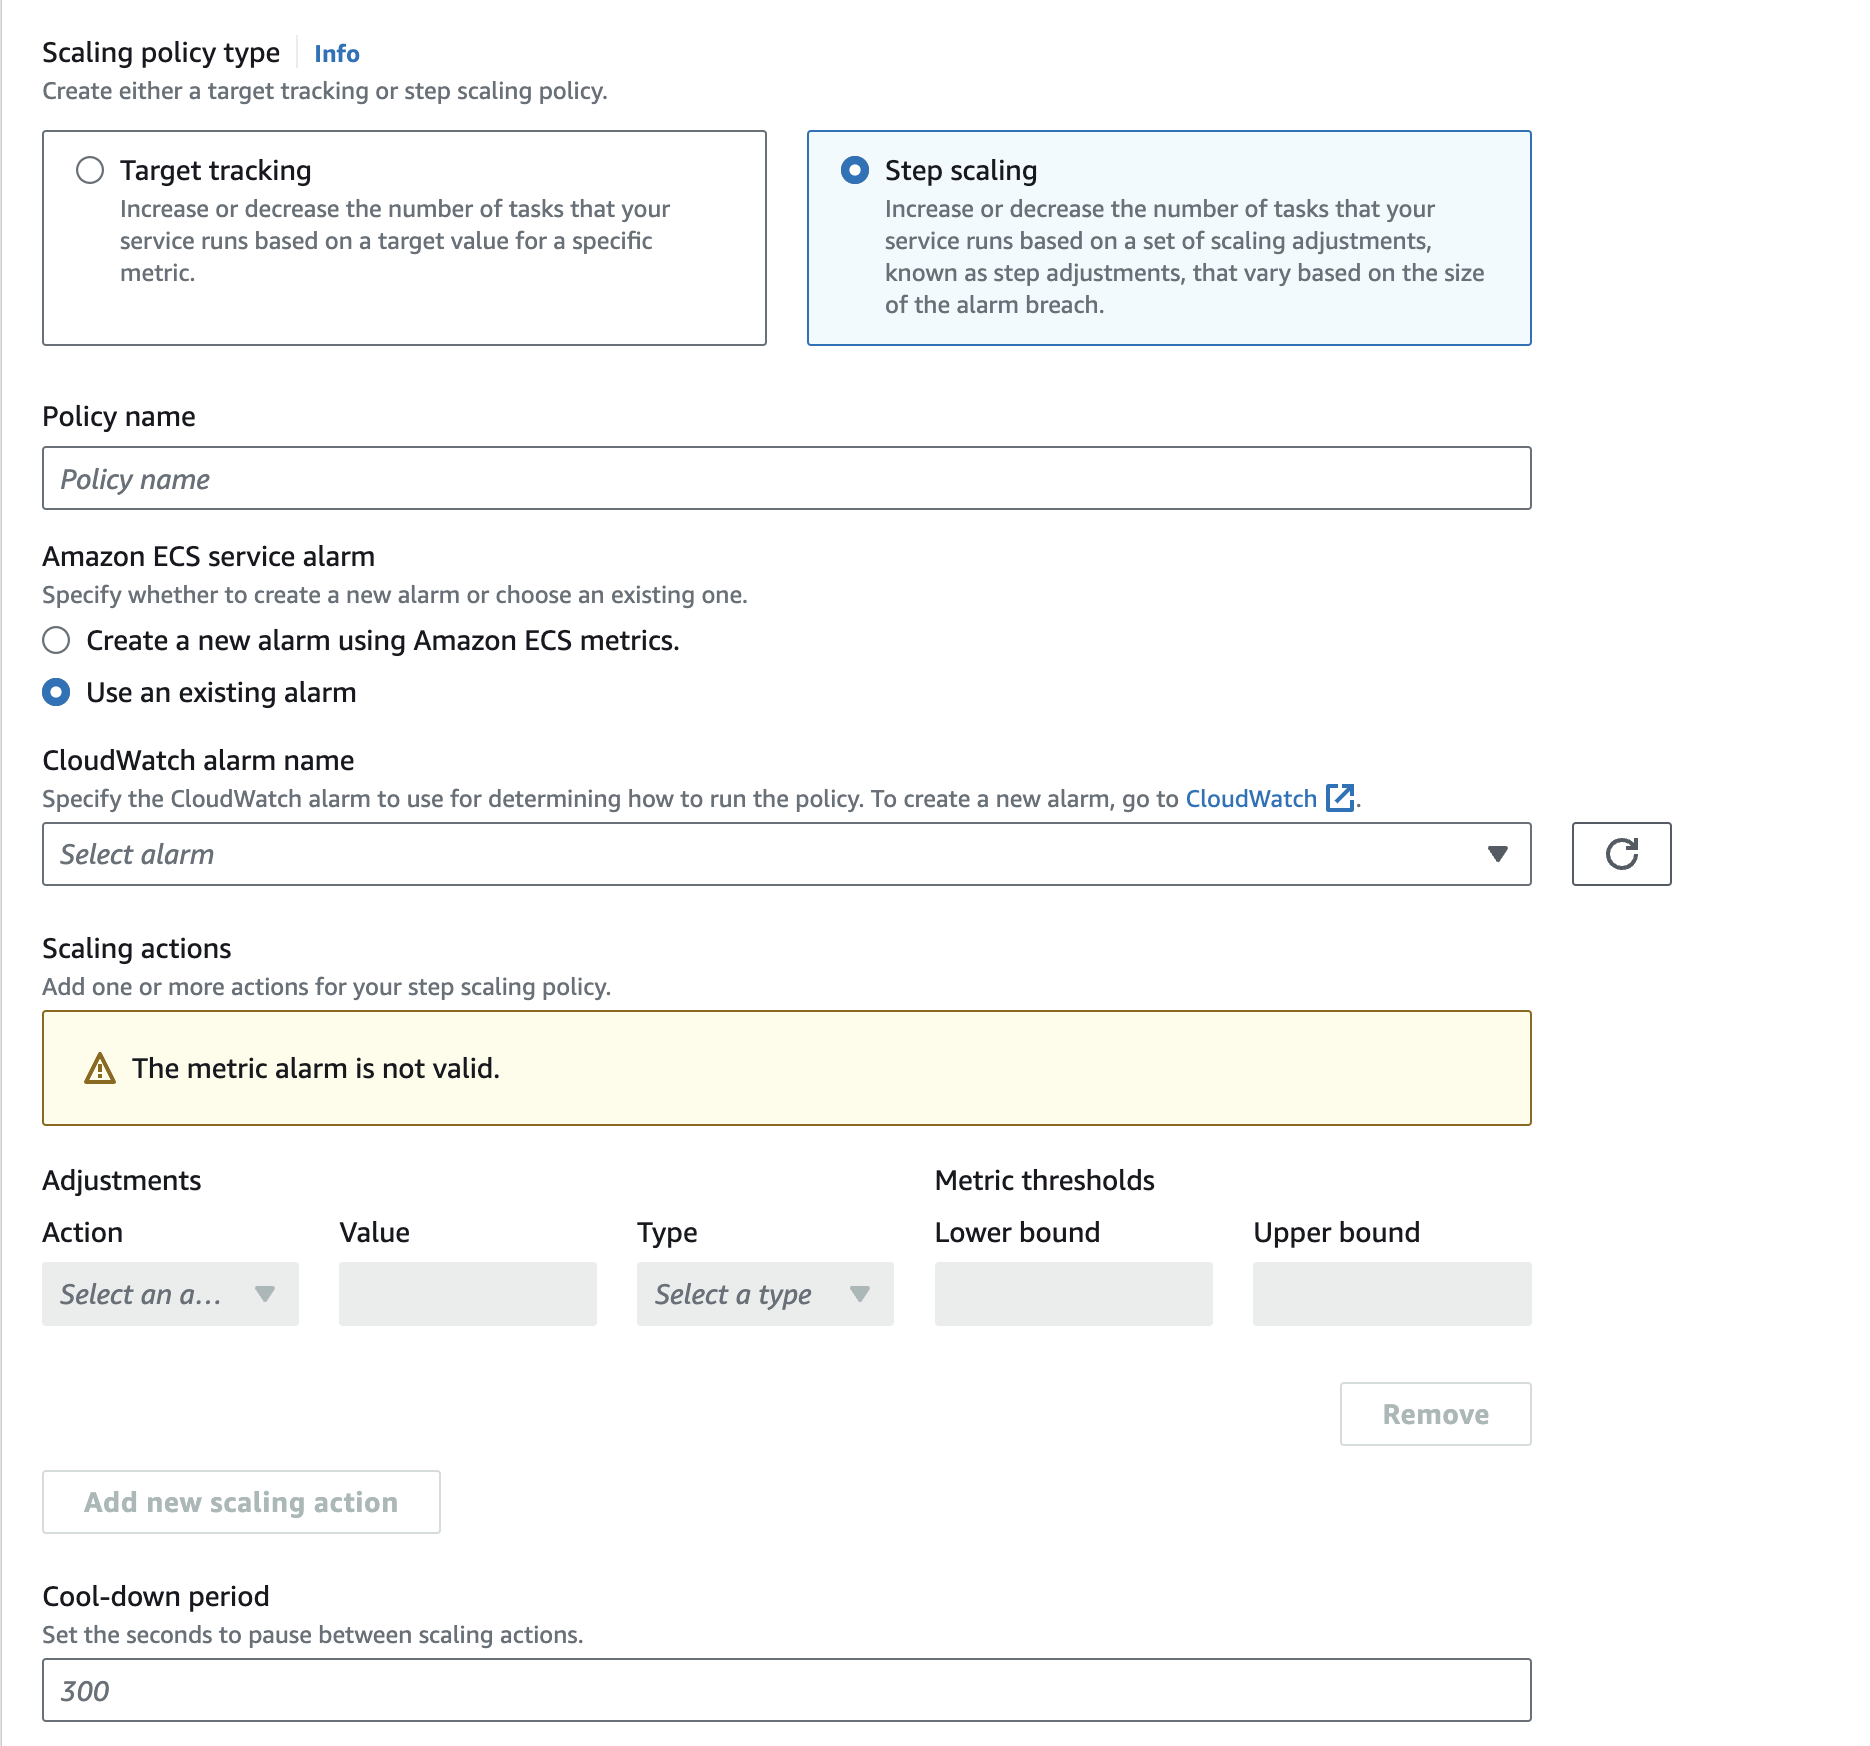
We can create any Cloudwatch alarm, an use that to scale an ECS service up or down. For a complete scaling solution, we need two alarms, one to scale the service up and another to scale it back to normal dimensions.
Now that we have a basic understanding of how an ECS service can scale, let’s look at some non-conventional metrics, metrics that are not shipped by AWS, for example
- scale a worker on queue length in Redis
- scale on a mysql query, etc
The first problem to tackle is how to ship the “metrics” from these “non-conventional” source to Cloudwatch and later we will discuss on a possible way to eliminate Cloudwatch altogether with our own custom autoscaler.
Shipping “non-conventional” metrics to Cloudwatch
TLDR: A simple PutMetricDataInput call does the job.
We can write a simple Go cron service, which queries these sources (redis, mysql, kafka, etc) to fetch the metric we are looking for, say length of a list in Redis, count result of a SQL query or lag on a Kafka consumer topic, etc. And then invokes the cloudwatch.PutMetricDataInput of the AWS SDK.
Example:
_, err = svc.PutMetricData(ctx, &cloudwatch.PutMetricDataInput{
    Namespace:  aws.String("Redis/QueueLength"),
    MetricData: []types.MetricDatum{
        {
            MetricName: aws.String("QueueLength"),
            Unit:       types.StandardUnitCount,
            Value:      aws.Float64(float64(activeQueue.Messages)),
            Dimensions: []types.Dimension{
                {
                    Name:  aws.String("QueueName"),
                    Value: aws.String(activeQueue.Name),
                },
            },
        },
    },
})
if err != nil {
    return err
}
This will publish length of queue under Redis/QueueLength metric in Cloudwatch and then can be used to create alarms.
Same thing can be extended to other sources as well.
Custom Autoscaler to replace Cloudwatch
Let’s explore a self-managed option.
Disclaimer: Might not be as effective as Cloudwatch but gets the job done.
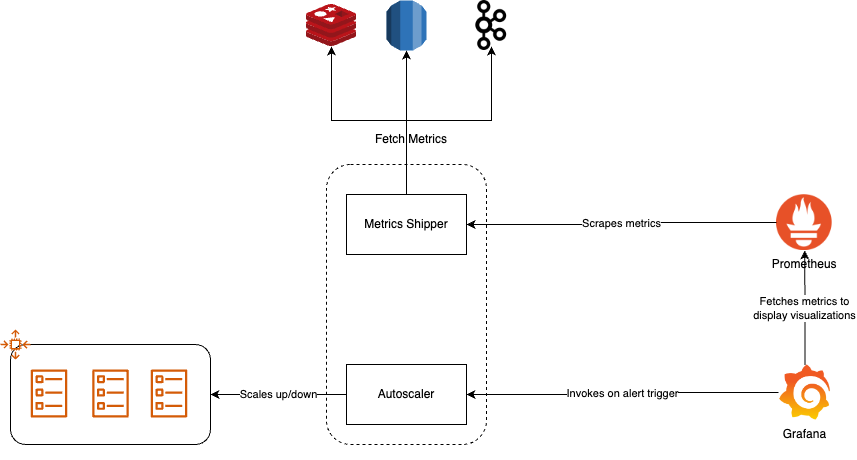
We will use the following components to implement our own in-house autoscaler
Metric Shipperto expose metrics in prometheus format on an http endpoint.Prometheusto scrape the above metrics at a regulat interval.Grafanato visualize these metrics and trigger alerts if something breaches.Autoscalerwhich listens on alert triggers fromGrafanaand performs autoscaling operations on AWS ECS.
Our architecture will look something like this:
Metrics Shipper
As per our discussion above in the Shipping "non-conventional" metrics to Cloudwatch section, fetching logic remains same, just the destination of these metrics change. We need to expose these metrics on an endpoint.
Prometheus community has support for golang client for doing just what we require.
We start the promhttp server:
func main() {
	http.Handle("/metrics", promhttp.Handler())

	log.Fatal(http.ListenAndServe(":9120", nil))
}
This exposes default metrics on 9120 and is ready to be scraped by Prometheus.
Now, lets expose some useful metrics here.
Create a gauge type metric:
gauge := prometheus.NewGauge( // registration phase
    prometheus.GaugeOpts{
        Namespace: "queue",
        Name:      "queue_length",
        Help:      "Queue length",
        ConstLabels: map[string]string{
            "queue": queue,
            "environment": environment,
        },
    },
)

gauge.Set(float64(10)) // push metrics
You will start seeing the metrics in prometheus format.
$ curl http://localhost:9120/metrics
# HELP queue_queue_length Queue length
# TYPE queue_queue_length gauge
queue_queue_length{environment="production",queue="some-queue"} 10
Prometheus and Grafana stack
We deploy Prometheus and Grafana with default configuration on Docker.
After deploying, we configure the Prometheus data store and create a dashboard with that metric.
Add an alert on the panel with destination as our autoscaler’s endpoint.
Autoscaler
We listen on alerts triggered by Grafana, parse them to get the exact value at which alert got triggered and the kick off our scaling logic.
if alert is ringing {
    if alert.Value > threshold {
        scaleup
    } else {
        scaledown
    }
} else if alert is ok {
    scaledown
}
For scale up/down, we need to add/remove tasks from ECS service, this can be done using UpdateService sdk call:
ecs.UpdateService(ctx, &ecsLib.UpdateServiceInput{
    Service:      aws.String(service_name),
    Cluster:      aws.String(service_luster),
    DesiredCount: aws.Int32(taskCount),
})
The logic to determine how many tasks to add or remove can either be linear or exponential, with jitter or fixed. Everything now become configurable via code.
Closing notes
I have been using this approach with some modifications for quite some time now in production, and the results are good. We are able to scale up very fast in burst scenarios and then scale down at same rate. You can have target tracking and step scaling both in the custom autoscaler.